AWAccess™ Dashboards
AWAccess™ Dashboards are designed to give users access to the data behind AWA’s reports. Users can access AWA’s unique and extensive databases and customize the
data to their specific needs. The AWAccess™ Dashboards provides the opportunity to filter data by Year, Region, Application Segment, Material, and Technology, and access precisely the information
required. Get AWAccess Dashboard as a go to resource for AWA’s historical and forecast data.

Get access to AWA’s extensive database of information
AWA has been providing market intelligence and insights since 1971. AWAccess™ Dashboards allow access to AWA’s
extensive databases. The databases include current, historical, and forecast volume and growth data.
Customize and filter
Filter the wealth of data that is available to select specific information and retrieve relevant volume and growth data. Save hours of research time with a few
clicks.
Data visualization
Your customized data is instantly turned into appealing and engaging visuals. Want to look at the data behind the charts? No problem: A data table is only one
click away
We have tiered options for our services
| Service | AWAccess Regular | AWAccess Pro |
|---|---|---|
| Access to all published reports | ✓ | ✓ |
| Access to single-site and corporate licenses | ✓ | ✓ |
| Available Consultancy support | ✓ | ✓ |
| Access to tables containing annual estimates | ✓ | ✓ |
| Access to raw data | ✓ | |
| Access to AWAccess™ interactive dashboards | ✓ | |
| Discount to AWA Conferences & Events | ✓ | ✓ |
| Dedicated AWA workshops | ✓ | |
| Granularity of data provided | Access to estimated year, previous year, and final forecast year in cross tabular format | 3 years of historical data, up to forecast year (*Additional historical data available upon discussion) |
| AWA Data Transcripts | ✓ | ✓ |
| Discounted Schönwald Reports | ✓ | ✓ |
All AWAccess™ Dashboards
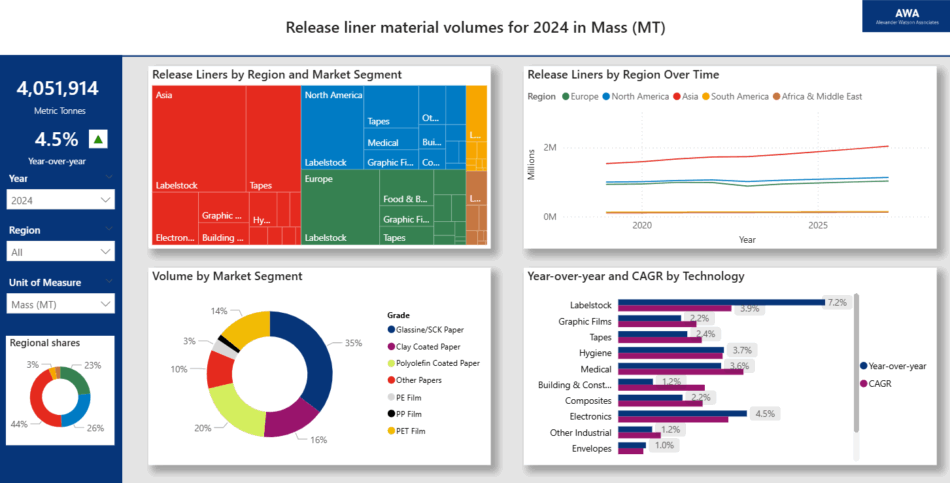
Slice and filter through AWA's release liner data by region, segment, and grade. Data is provided by area and mass.

This dashboard gives access to label volume data and growth by region, label technology, end-use segment & material
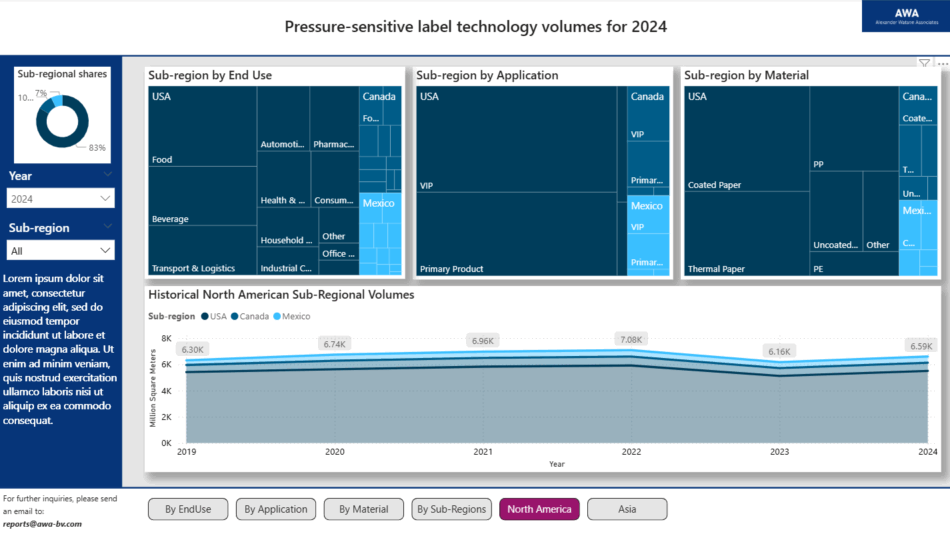
This dashboard gives access to PS label volumes and growth by region, segment, application, material and subregion
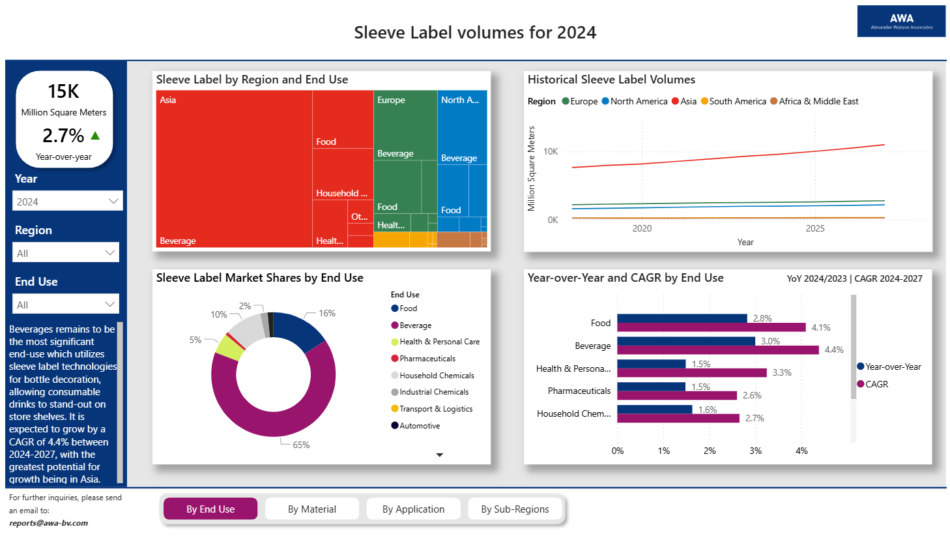
This dashboard lets you go through the sleeve label market report by end-use, application, material, and subregion
